Every few years, the tropical Pacific Ocean changes dramatically. Trade winds weaken, warm water moves eastward and weather patterns shift worldwide. El Niño can trigger droughts, floods, wildfires, food shortages and extreme heat far beyond the Pacific.
Article by Svetlana Markoff.
What Exactly Is El Niño?
El Niño is a natural climate phenomenon. It usually develops every two to seven years across the tropical Pacific Ocean. Under normal conditions, strong trade winds push warm surface water towards Indonesia and Australia. Meanwhile, colder water rises near South America. This colder water carries nutrients from deeper parts of the ocean and supports marine ecosystems.
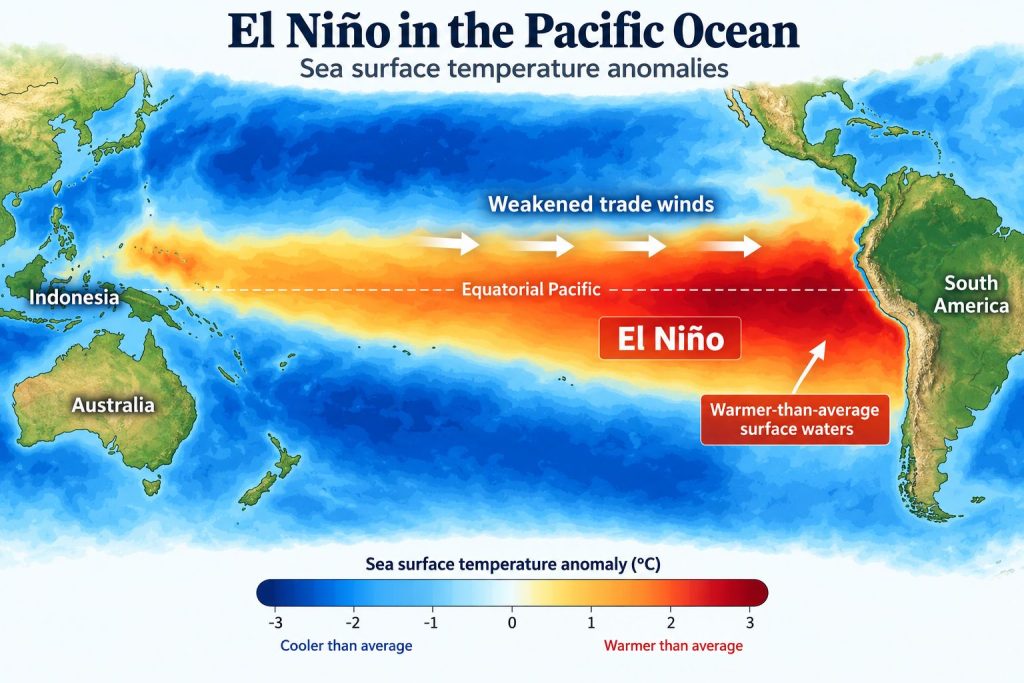
During El Niño, the trade winds weaken. Warm water then moves back towards the central and eastern Pacific. This shift reduces the normal rise of cold water near South America. It also changes atmospheric circulation above the ocean. These changes can influence rainfall and temperatures across many regions.
El Niño forms part of the El Niño–Southern Oscillation, also called ENSO. La Niña represents the opposite phase. During La Niña, cooler waters dominate parts of the central and eastern tropical Pacific. Trade winds also become stronger.
When the Pacific Changes, Weather Changes Too
The tropical Pacific covers a huge area. Changes in its temperature can therefore affect weather systems across several continents. During El Niño, rainfall patterns often shift. Some regions receive heavy rain, while others face drought and prolonged heat.
Parts of South America can experience unusually intense rainfall. Australia, Indonesia and Southeast Asia may face much drier conditions. These changes create serious problems for agriculture. Drought can reduce harvests, damage crops and limit water supplies. Heavy rainfall can also flood farmland and disrupt transport.
In Indonesia, long dry periods can increase the risk of forest and peatland fires. El Niño can also affect marine ecosystems. Warmer waters can reduce nutrient supply along parts of South America. Fish populations may move elsewhere, which can affect local fisheries.
Powerful El Niño Events in History
Some El Niño events have caused major disruptions throughout history. The 1877–1878 event coincided with severe droughts, crop failures, famine and disease across several regions. Researchers estimate that tens of millions of people died during this wider global crisis. Several social and political factors worsened the impacts.
The 1997–1998 El Niño became one of the strongest events recorded during the modern period. Heavy rainfall affected parts of the Americas. At the same time, Indonesia suffered severe drought and widespread fires.
Another powerful event developed in 2015–2016. Temperatures in parts of the central Pacific rose more than 2°C above average.
El Niño in a Warmer World
Climate change does not cause El Niño. The phenomenon existed long before modern industrialisation. However, El Niño now develops on a much warmer planet. Human activities have increased greenhouse gas concentrations and raised global temperatures.
El Niño can add temporary natural warming to this long-term trend. This combination can push temperatures higher. It can also increase pressure on agriculture, ecosystems, water supplies and public health. Scientists still study how climate change may influence future El Niño events.
They do not expect every event to become stronger. However, warmer conditions can intensify some consequences. Higher temperatures can worsen heatwaves. Warmer air can also hold more moisture and support heavier rainfall.
Food, Health and Economies Under Pressure
El Niño can quickly create economic and humanitarian problems. Drought can reduce harvests of rice, wheat, coffee and other important crops. Heavy rainfall can also destroy crops and disrupt transport. These problems can reduce food supplies and push prices higher.
Poorer communities often face the greatest risks. They usually have fewer resources to absorb food price increases. Extreme heat also threatens human health and can increase heat-related illness and deaths.
Changes in rainfall can affect mosquito populations. This may influence diseases such as dengue and malaria. Drought can increase wildfire risk, while heavy rainfall can create floods, erosion and landslides. The final impact depends on more than El Niño itself. Local preparation and infrastructure also play major roles.
Did You Know?
The name El Niño means “the boy” or “the Christ Child” in Spanish. Peruvian fishermen used this name for unusually warm coastal waters. They often noticed these warmer waters around Christmas.
A Global Climate Signal Born in the Pacific
El Niño shows how closely connected the global climate system remains. Changes in the Pacific can influence rainfall in Africa and fires in Southeast Asia. They can also affect fisheries in South America and weather patterns across North America.
Scientists monitor the Pacific with satellites, ocean buoys and atmospheric observations. These tools can detect El Niño several months before its peak. However, scientists still struggle to predict its exact strength and local impacts.
El Niño remains a natural phenomenon, but human societies can reduce their vulnerability. Better water management can help communities prepare. Stronger food systems can reduce risks. Governments can also improve wildfire prevention and early-warning networks.
FAQ
El Niño usually develops every two to seven years. However, the cycle does not follow a fixed schedule.
Most El Niño events last between nine and twelve months. Some events can continue for longer.
No. El Niño is a natural climate phenomenon. Climate change can still increase some of its impacts.
El Niño brings warmer waters to the central and eastern tropical Pacific. La Niña usually brings cooler waters.
Scientists can often detect El Niño several months in advance. They study ocean temperatures, winds and atmospheric pressure. Predicting its exact strength remains more difficult.
Follow us on Instagram and Facebook to stay informed
This article may be of interest to you: